research
Current research themes and projects in the Enquist Macroecology Lab
Research Program
Our lab develops theory and data-driven tools to explain how biodiversity is organized across scales, and how it is changing under climate and land-use pressure.
We organize our work as a connected process: observations and traits → scaling and trait-based theory → predictive models → uncertainty-aware ecological forecasting.
Current themes include:
- Scaling in biology and allometry
- Forecasting the fate of biodiversity and the biosphere
- Trait-based ecology as a foundation for predictive ecology and biodiversity science
- Biodiversity informatics
- Macroecology of biodiversity gradients
- Ecology and evolution of plant functional and physiological integration
- Long-term monitoring of populations, communities, and ecosystems in tropical, temperate, and alpine environments
Our research flows from observation to prediction: we measure organisms and ecosystems, build theories about why patterns emerge across levels of biological organization, and test whether those theories can forecast how biodiversity responds to global change.
Theory
The lab’s empirical programs are grounded in two interconnected theoretical frameworks — Metabolic Scaling Theory (MST) and Trait Driver Theory (TDT) — that together aim to explain biological organization from cells to ecosystems and predict how communities respond to environmental change. Both frameworks are mathematically explicit: they generate quantitative, falsifiable predictions that can be confronted with data and refined.
Metabolic Scaling Theory (MST)

- Vasseur, Mahaut, Enquist & Violle (2025) — From organism traits to ecosystem processes: why size is so important. Ann. Rev. Ecol. Evol. Syst.
- Enquist, Erwin, Savage & Marquet (2024) — Scaling approaches and macroecology for ecological resilience in the Anthropocene. Phil. Trans. B
- Enquist, Kempes & West (2024) — Developing a predictive science of the biosphere. PNAS
- Enquist et al. (2020) — The megabiota are disproportionately important for biosphere functioning. Nature Communications
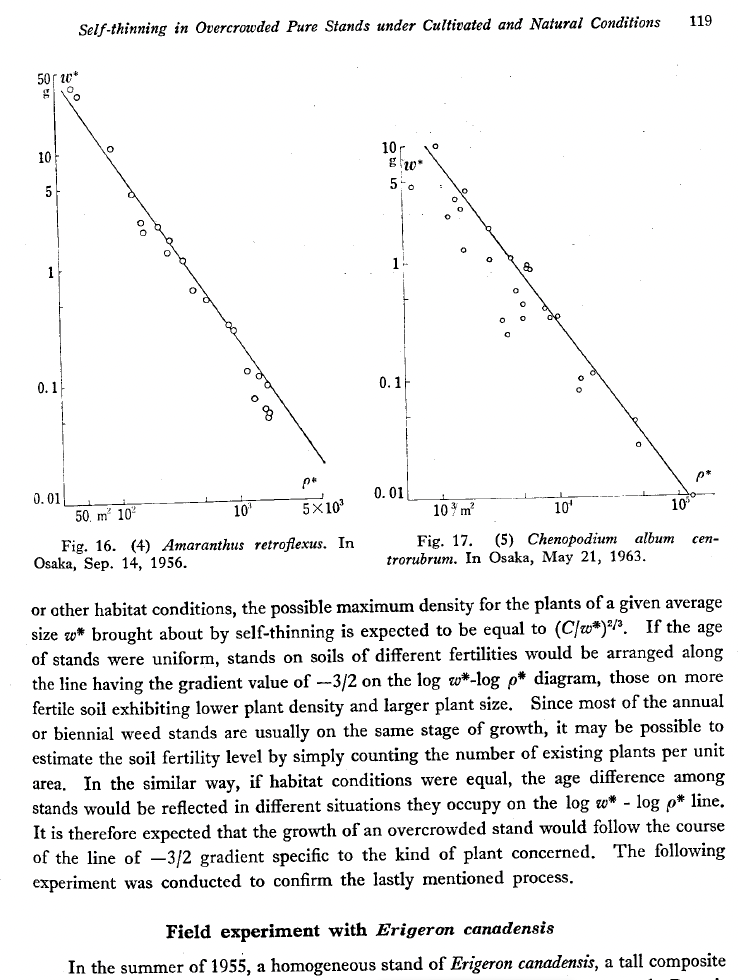
Metabolic Scaling Theory rests on a central insight: the branching tubes that deliver water and nutrients through a plant or animal are not arranged arbitrarily — they follow a geometry dictated by physics. That geometry imposes a universal constraint on how metabolic rate — the pace at which an organism burns energy — scales with body size. West, Brown, and Enquist showed that a space-filling, area-preserving fractal vascular network minimizes energy dissipation and thereby generates the ¾-power scaling of metabolic rate with body mass, \(B \propto M^{3/4}\) (West, Brown & Enquist 1997). Subsequent empirical tests have confirmed this relationship across more than 27 orders of magnitude in body mass (Gillooly et al. 2001; Savage et al. 2004). This is not merely an empirical regularity — it is a derived consequence of network geometry and fluid-transport physics.
From this foundation, the theory generates a unified set of predictions. Growth rates, lifespan, reproductive output, and the turnover of energy and biomass all scale predictably with body size and temperature (West, Brown & Enquist 1999). In plants, the fractal vascular network constrains stem diameter, height, and leaf-area allometries (West, Enquist & Brown 1999), and metabolic constraints set population density and above-ground biomass across forests (Enquist, Brown & West 1998). Temperature scales metabolic rate through a well-characterized thermodynamic relationship: warmer organisms run faster metabolically. This grounds MST in physics rather than empiricism and creates a direct bridge to global-change projections — warmer climates predictably accelerate biological processes across levels of organization.
Brown et al. extended MST into the Metabolic Theory of Ecology (MTE) (Brown et al. 2004), showing that the same mass and temperature scaling permeates population dynamics, species diversity gradients, ecosystem energy flux, and elemental stoichiometry. Current Enquist Lab work extends and tests MST predictions at ecosystem scale — connecting allometric constraints to forest carbon stocks, demography, and the structure of plant communities across biomes. Recent work examines how MST principles scale from organism traits and stoichiometry to ecosystem function (Enquist, Michaletz & Kerkhoff 2016 / PDF), how the megabiota disproportionately drive biosphere functioning (Enquist et al. 2020), and how scaling frameworks underpin assessments of ecological resilience in the Anthropocene (Enquist, Erwin, Savage & Marquet 2024).
Scope: subcellular metabolic pathways to biome-level carbon budgets. Goal: derive macroecological patterns from first principles of physics and network geometry. Applications: forest biomass and carbon modeling, demographic forecasting, climate-scaling of plant productivity, earth system model parameterization.
Key papers:
- West, Brown & Enquist (1997) — fractal vascular networks and the ¾ scaling law
- West, Brown & Enquist (1999) — fractal geometry and allometric scaling across life
- West, Enquist & Brown (1999) — general model for plant vascular structure and allometry (Nature)
- Enquist, Brown & West (1998) — plant population density and biomass scaling
- West, Enquist & Brown (2009) — a general quantitative theory of forest structure and dynamics
- Enquist, Michaletz & Kerkhoff (2016) (PDF) — Toward a general scaling theory linking traits, stoichiometry, and body size to ecosystem function. In: Ecosystems: A Biogeoscience Approach (Johnson & Martin, eds.), Cambridge University Press
- Enquist et al. (2020) — The megabiota are disproportionately important for biosphere functioning (Nature Communications)
- Enquist, Erwin, Savage & Marquet (2024) — Scaling approaches and macroecology provide a foundation for assessing ecological resilience in the Anthropocene (Phil. Trans. B)
- Vasseur, Mahaut, Enquist & Violle (2025) — From organism traits to ecosystem processes: why size is so important (Ann. Rev. Ecol. Evol. Syst.)
Trait Driver Theory (TDT)
- Chacón-Labella et al. (2022) — How to improve scaling from traits to ecosystem processes. Trends Ecol. Evol.
- Maitner et al. (2023) — Bootstrapping outperforms community-weighted approaches for estimating trait distributions. Methods Ecol. Evol.
- Wieczynski et al. (2022) — Integrating trait-based models and remotely-sensed foliar trait data. Ecography
While MST explains size- and temperature-dependent variation in metabolic flux, Trait Driver Theory addresses a complementary question: why do communities assemble the functional trait distributions they do, and how will those distributions shift as environments change? TDT is a quantitative, mechanistic framework that predicts the mean, variance, and shape of functional trait distributions in a local community as a function of environmental drivers — temperature, water availability, disturbance, and resource supply (Enquist et al. 2015).
The core logic is probabilistic and multi-scale. At the regional scale, the pool of available species defines a prior distribution of trait values shaped by evolutionary history and dispersal. At the local scale, environmental filters and biotic interactions select from that pool, shifting the realized trait distribution in predictable directions. TDT formalizes this filtering mathematically: environmental drivers compress, shift, or broaden the trait distribution, with measurable consequences for community function. Because intraspecific trait variation (ITV) contributes substantially to total community-level trait variance, TDT explicitly partitions variation across levels — individual, population, species, and community — rather than collapsing it to species means. Empirical tests across tropical forests spanning broad temperature gradients confirm that environmental drivers shift functional trait distributions in the directions TDT predicts (Enquist et al. 2017).
TDT bridges scales that are often treated separately in ecology: individual physiology sets the trait values that are possible; evolutionary history determines what is available in a regional pool; environment determines what is favored locally; and the aggregate of these processes produces the community-level functional fingerprint that shapes carbon exchange, water flux, and competitive dynamics at ecosystem scale. This positions TDT as a theoretical spine connecting leaf-level measurements to global biodiversity forecasting.
Scope: individual leaf traits to continental-scale functional diversity gradients. Goal: build a predictive, mathematically grounded theory of community assembly and ecosystem function based on trait distributions. Applications: forecasting community trait shifts under climate change, explaining elevational and latitudinal diversity gradients, linking remote-sensing spectral signatures to functional state, improving land-surface model trait parameterizations.
Key papers:
- Enquist et al. (2015) — original TDT framework and predictions
- Enquist et al. (2017) — assessing trait-based scaling theory across tropical forests spanning a broad temperature gradient (Global Ecol. Biogeogr.)
Trait-Based Ecology


- Maitner et al. (2023) — Bootstrap trait distributions outperform community-weighted means. Methods Ecol. Evol.
- Enquist et al. (2017) — Trait-based scaling across tropical forests. Global Ecol. Biogeogr.
- Kemppinen et al. (2021) — Consistent trait–environment relationships in tundra. Nat. Ecol. Evol.
- Gallagher et al. (2020) — Open Traits Network. Nat. Ecol. Evol.
- Wieczynski et al. (2022) — Remote-sensing + trait models. Ecography
Plant functional traits — leaf size, wood density, height, specific leaf area, water-use efficiency — are not merely descriptions of what plants look like. They are the currencies through which organisms manage their acquisition of carbon, water, and nutrients, and the entries through which evolution, environment, and ecological filtering jointly shape community composition. The lab’s trait-based ecology program is organized around a single driving question: can we use the statistical distributions of functional traits within communities to predict how those communities will change as climates shift?
The theoretical backbone is Trait Driver Theory (TDT), developed and tested in this lab (Enquist et al. 2015; Enquist et al. 2017), which predicts how trait distributions — not just mean values — shift as a direct function of environmental drivers. A key insight is that the shape of a trait distribution encodes information about ecological filtering and community assembly that the mean discards. Maitner et al. (2023) (Methods Ecol. Evol.) demonstrated that standard community-weighted approaches systematically underestimate distributional tails — the parts of the trait distribution most sensitive to environmental extremes. The traitstrap R package formalizes a bootstrap-based remedy, propagating intraspecific uncertainty through community-level calculations. Kemppinen et al. (2021) (Nat. Ecol. Evol.) confirmed that consistent trait–environment relationships hold within and across tundra communities, supporting TDT’s core assumption that environment is a strong filter on which traits are expressed locally. Integrating remotely sensed spectral data with ground-based trait measurements further enables scaling functional diversity from plots to continents (Wieczynski et al. 2022, Ecography).
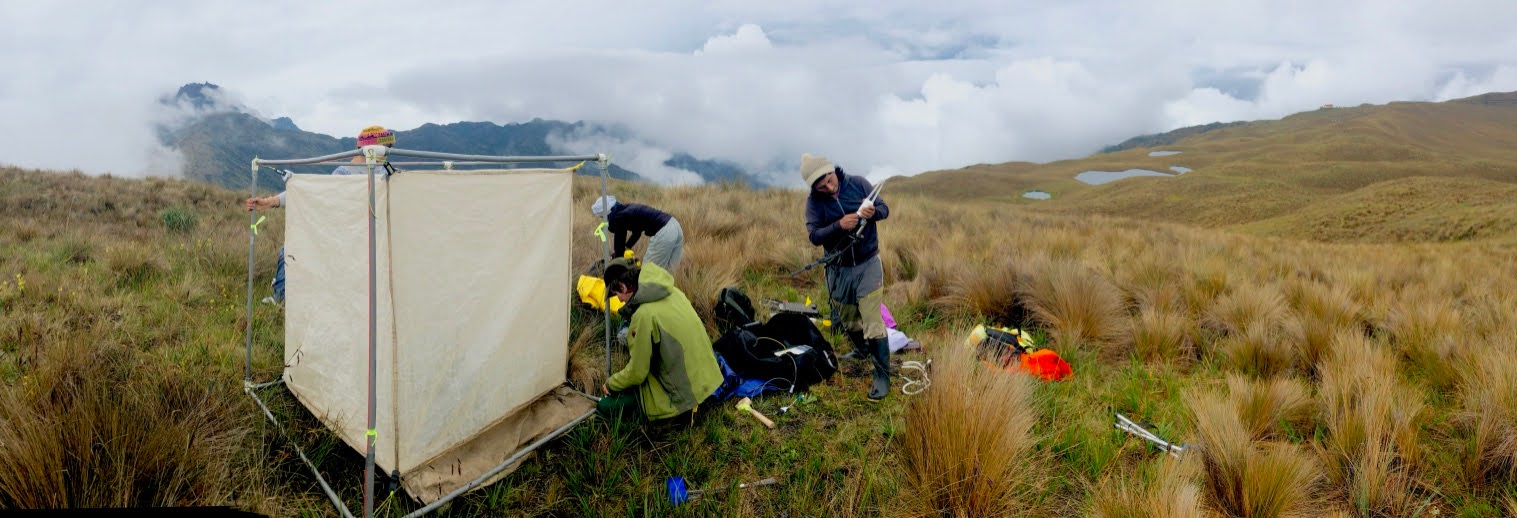
Measurement and scale. The lab co-organizes the international Plant Functional Traits Courses (PFTC) — a program in which field courses produce open, publishable datasets as a direct pedagogical output. Published campaigns span Norway climate gradients (Vandvik et al. 2025, Scientific Data), Andean Puna grasslands in Peru (Halbritter et al. 2024, Scientific Data), and Afromontane grasslands of South Africa (Halbritter et al. 2025, Scientific Data). These campaigns link individual trait measurements to ecosystem gas fluxes along environmental gradients, testing whether trait-based models built on plots can scale to landscapes. At broader scales, lab contributions to TRY, OpenTraits, and BIEN include establishing data-quality standards for trait synthesis (Gallagher et al. 2020, Nat. Ecol. Evol.; Keller et al. 2023, Methods Ecol. Evol.).
Forward look. The next challenge is closing the loop from trait measurement to ecological forecast. Using measured trait distributions — including their bootstrapped uncertainty — to predict community responses to novel climates requires integrating traitstrap-style tools with demographic models, spectral remote sensing, and process-based land-surface frameworks. A key open question is whether trait–environment relationships calibrated in contemporary gradient studies transfer reliably to novel climatic states — the same extrapolation problem that challenges SDMs. Addressing it requires out-of-range validation, mechanistic model constraints, and explicit uncertainty quantification.
Ecophysiology
Ecophysiology — the study of how physical and physiological processes interact to govern plant function — is an area of sustained innovation in this lab. Building on the mechanistic foundations of Metabolic Scaling Theory, lab members extended physics, geometry, and physiology to explain why leaves are built the way they are, how they regulate temperature, how plant communities exchange carbon and water with the atmosphere, and how xylem network architecture constrains water transport from roots to leaves. These contributions span from vein-level biophysics to ecosystem-scale flux measurements, uniting individual organ function with broader macroecological patterns.
Leaf Venation & Leaf Functioning
- Matos et al. (2025) — Leaf venation network evolution across clades and scales. Nature Plants.
- Blonder, Salinas, Bentley, Shenkin et al. & Enquist (2018) — Structural and defensive roles of angiosperm leaf venation network reticulation across an Andes–Amazon elevation gradient.
- Blonder, Violle, Bentley & Enquist (2011) — Leaf venation networks and the origin of the leaf economics spectrum. Ecology Letters 14:91–100.
- Blonder & Enquist (2014) — Inferring climate from angiosperm leaf venation network geometry. New Phytologist 204:116–126.
- Blonder, Violle, Bentley & Enquist (2014) — Inclusion of vein traits improves predictive power for the leaf economic spectrum. J. Exp. Bot. 65:5109–5114.
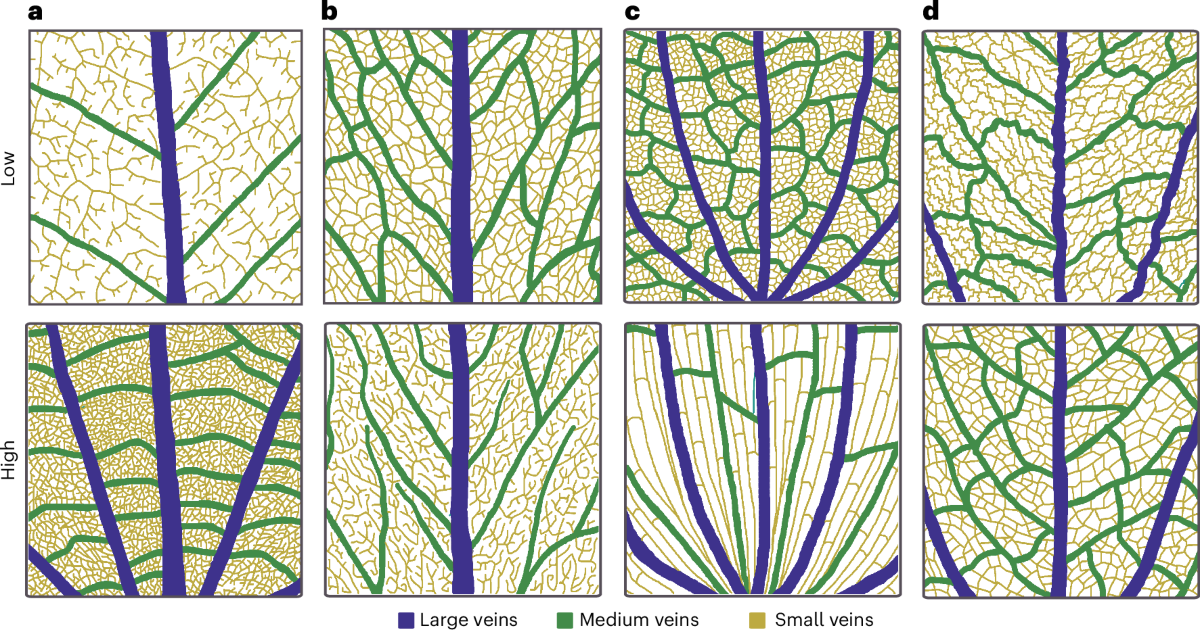
Leaf venation networks are biological distribution networks whose branching geometry, vein density, and topological reticulation set physical constraints on water delivery to mesophyll cells, CO₂ diffusion paths, and the energy budget of the leaf. The lab contributed a biophysical framework treating vein networks as optimized hydraulic circuits: vein density determines flow resistance from xylem conduit to cell, which in turn governs maximum stomatal conductance and photosynthetic capacity. This is network and graph theory applied to organ biology — the same first-principles logic that underlies metabolic scaling, now resolved at millimeter scales within a leaf lamina.
Empirically, Blonder et al. (2011) showed that vein geometry is a mechanistic origin of the leaf economic spectrum — the multivariate axis of leaf form and function encapsulating the slow–fast resource-acquisition continuum — and Blonder et al. (2014, J. Exp. Bot.) demonstrated that including vein traits substantially improves its predictive power. Vein reticulation also varies systematically along the steep Andes–Amazon elevational gradient, reflecting structural reinforcement against herbivory and hydraulic adaptations to the combined stresses of freeze-thaw cycles and declining atmospheric pressure at altitude (Blonder et al. 2018). Matos et al. (2025, Nature Plants) extended this perspective phylogenetically, revealing how vein network architecture has evolved across angiosperm clades and spatial scales, shaped jointly by developmental constraints, hydraulic selection, and evolutionary history.
Leaf Thermoregulation
- Michaletz, Weiser, Zhou, Kaspari, Helliker & Enquist (2015) — Plant thermoregulation: energetics, trait–environment interactions, and carbon economics. Trends Ecol. Evol. 30:714–724.
- Michaletz, Weiser, McDowell, Zhou, Kaspari, Helliker & Enquist (2016) — The energetic and carbon economic origins of leaf thermoregulation. Nature Plants 2:16129.
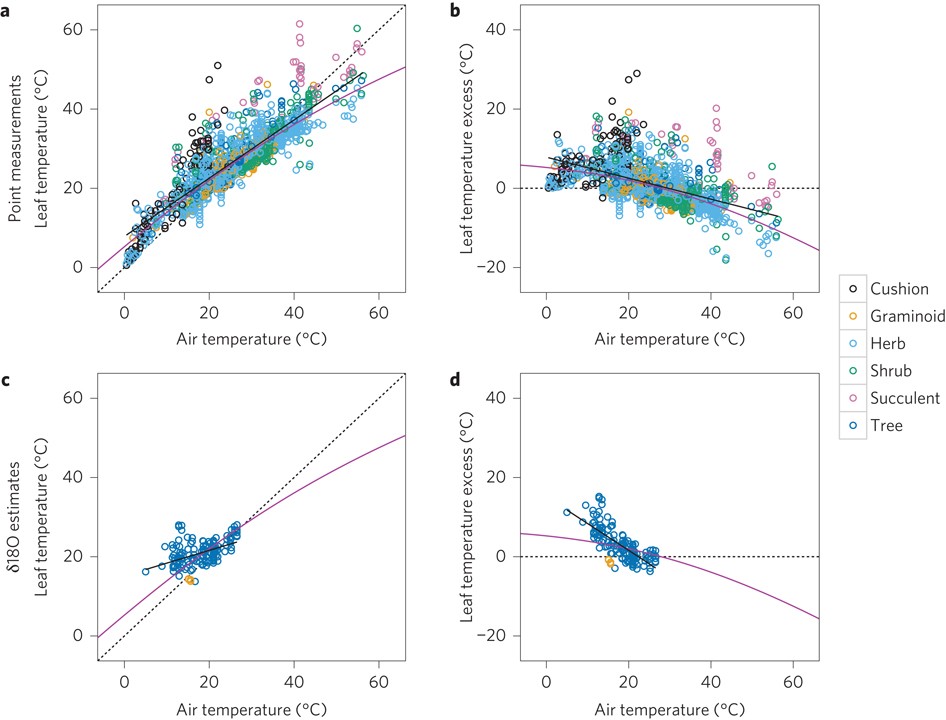
Leaves are not passive temperature recorders. They actively modulate their temperature through transpirational cooling, boundary layer conductance, and leaf geometry — size, shape, and orientation all govern how heat is exchanged with the surrounding atmosphere. Michaletz, Enquist, and colleagues developed an energy-balance biophysical framework that predicts the offset between leaf temperature and air temperature as a function of absorbed radiation, wind speed, stomatal conductance, and leaf size. This offset is not a minor correction: it can exceed several degrees Celsius under high-radiation, low-wind conditions, with meaningful consequences for enzymatic rates, stomatal behavior, and water-use efficiency.
The macroecological implication is significant. Standard correlative analyses that link plant traits to climate using ambient air temperature may systematically misrepresent the thermal environment that leaf biochemistry actually experiences. Incorporating energy-balance physics into trait–climate frameworks yields mechanistically grounded predictions of how functional trait distributions will shift as both air temperature and vapor pressure deficit increase under climate change — and identifies where correlative approaches are most likely to fail.
Plant Community Carbon & Water Exchange
- Sloat, Henderson, Lamanna & Enquist (2015) — The effect of the foresummer drought on carbon uptake across western U.S. grasslands. Ecosystems 18:533–545.
- Sørensen, Strimbeck, Nystuen, Kapas, Enquist & Graae (2017) — Draining the pool? Carbon storage and fluxes in three alpine plant communities. Ecosystems 21:316–330.
- Gaudard, Telford, Chacon-Labella, Dawson, Enquist, Töpper et al. & Halbritter (2025) — fluxible: An R package to process ecosystem gas fluxes from closed-loop chambers in an automated and reproducible way. Methods Ecol. Evol.
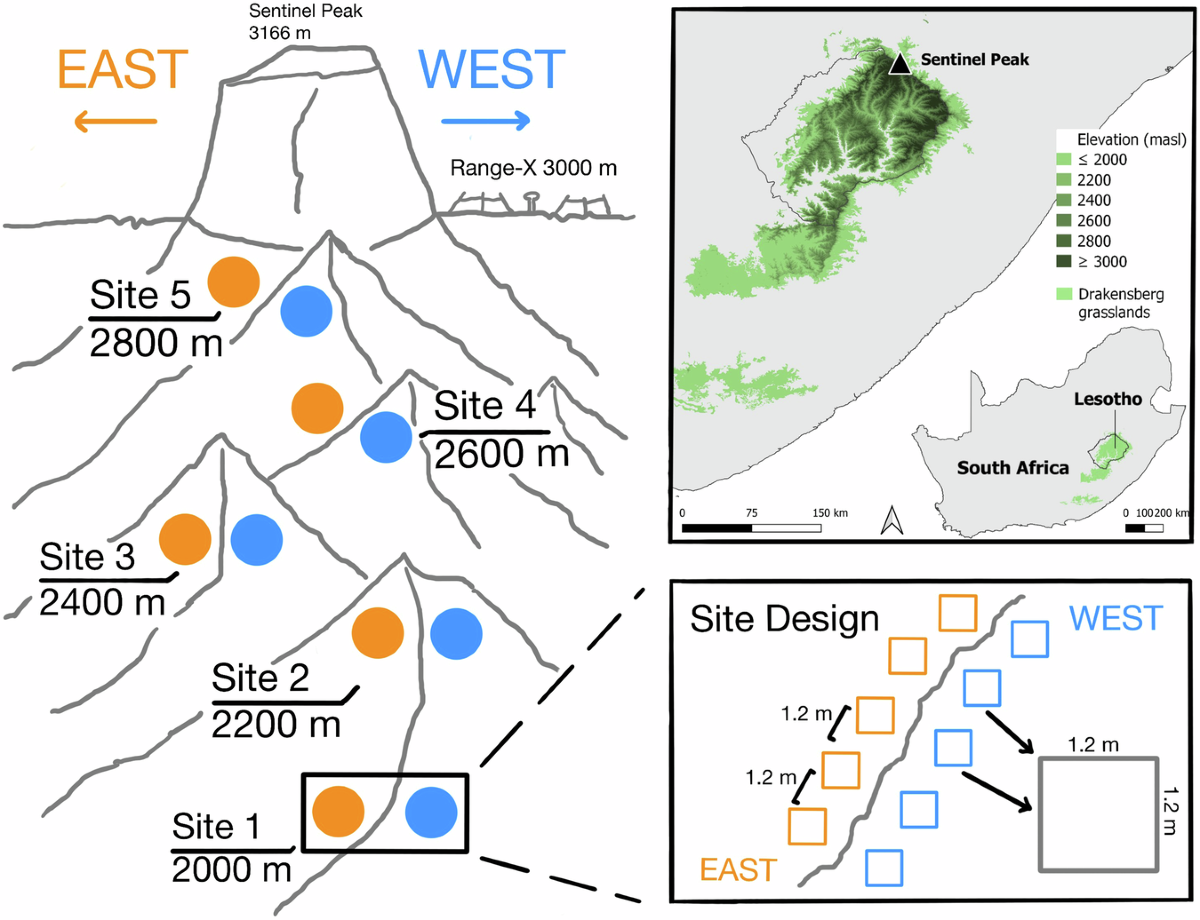
- Halbritter, Vandvik, Bison, Clark, Cross, Greve et al. & Enquist (2025) — Plant traits and associated ecological data from Afromontane grasslands of Maloti-Drakensberg, South Africa. Scientific Data 12(1):1778.
Connecting individual leaf function to ecosystem-scale carbon and water balance requires measurements at multiple spatial scales. The lab has contributed to closed-loop and open-path chamber-based approaches that capture net ecosystem exchange of CO₂ and H₂O at fine spatial resolutions, complementing eddy covariance flux towers and enabling reproducible measurements in remote or structurally complex ecosystems where tower deployment is impractical. A key finding from this work is that community composition — not just climate — is a primary mediator of ecosystem carbon uptake: Sloat, Henderson, Lamanna & Enquist (2015) (Ecosystems 18:533–545) showed that the foresummer drought — the window of low soil moisture between snowmelt and summer monsoon rains at Rocky Mountain sites — significantly suppresses net ecosystem carbon uptake, and that whether a meadow is forb-dominated or grass-dominated determines the magnitude of that suppression. This sensitivity to vegetation functional composition means that trait-based characterizations of communities are necessary inputs to carbon flux models, not just descriptors. Sørensen et al. (2017) extended this comparative approach across three alpine plant community types, demonstrating community-level variation in carbon storage and flux balance under analogous climate pressures.
The fluxible R package, co-authored by Enquist and collaborators, provides an automated and reproducible workflow for processing raw chamber flux time series — from gas concentration change curves to net ecosystem exchange estimates — with explicit uncertainty propagation and standardized output formats for multi-site comparisons. The lab has also released co2fluxtent, an internally developed R package designed for open-path flux tent deployments, extending the lab’s chamber-based toolchain to additional measurement configurations. This tooling underpins field campaigns including work in the Maloti-Drakensberg Afromontane grasslands of South Africa, an ecosystem poorly represented in global carbon budgets. The associated trait and ecological dataset (Halbritter et al. 2025) links functional trait variation to ecosystem functioning in high-altitude grasslands under increasing climate pressure, providing a reproducible foundation for future synthesis across Afromontane biomes.
Plant Hydraulics & Path Length
- Enquist (2003) — Cope's Rule and the evolution of long-distance transport in vascular plants: allometric scaling, biomass partitioning, and optimization. Plant, Cell & Environment 26:151–161.
- Savage, Bentley, Enquist, Sperry, Smith, Reich & von Allmen (2010) — Hydraulic tradeoffs and space-filling enable predictions of vascular structure and function in plants. PNAS 107:22722–22727.
- Smith, Sperry, Enquist, Savage, McCulloh & Bentley (2014) — Deviation from symmetrically self-similar branching in trees predicts altered hydraulics, mechanics, light interception and metabolic scaling. New Phytologist 201:217–229.
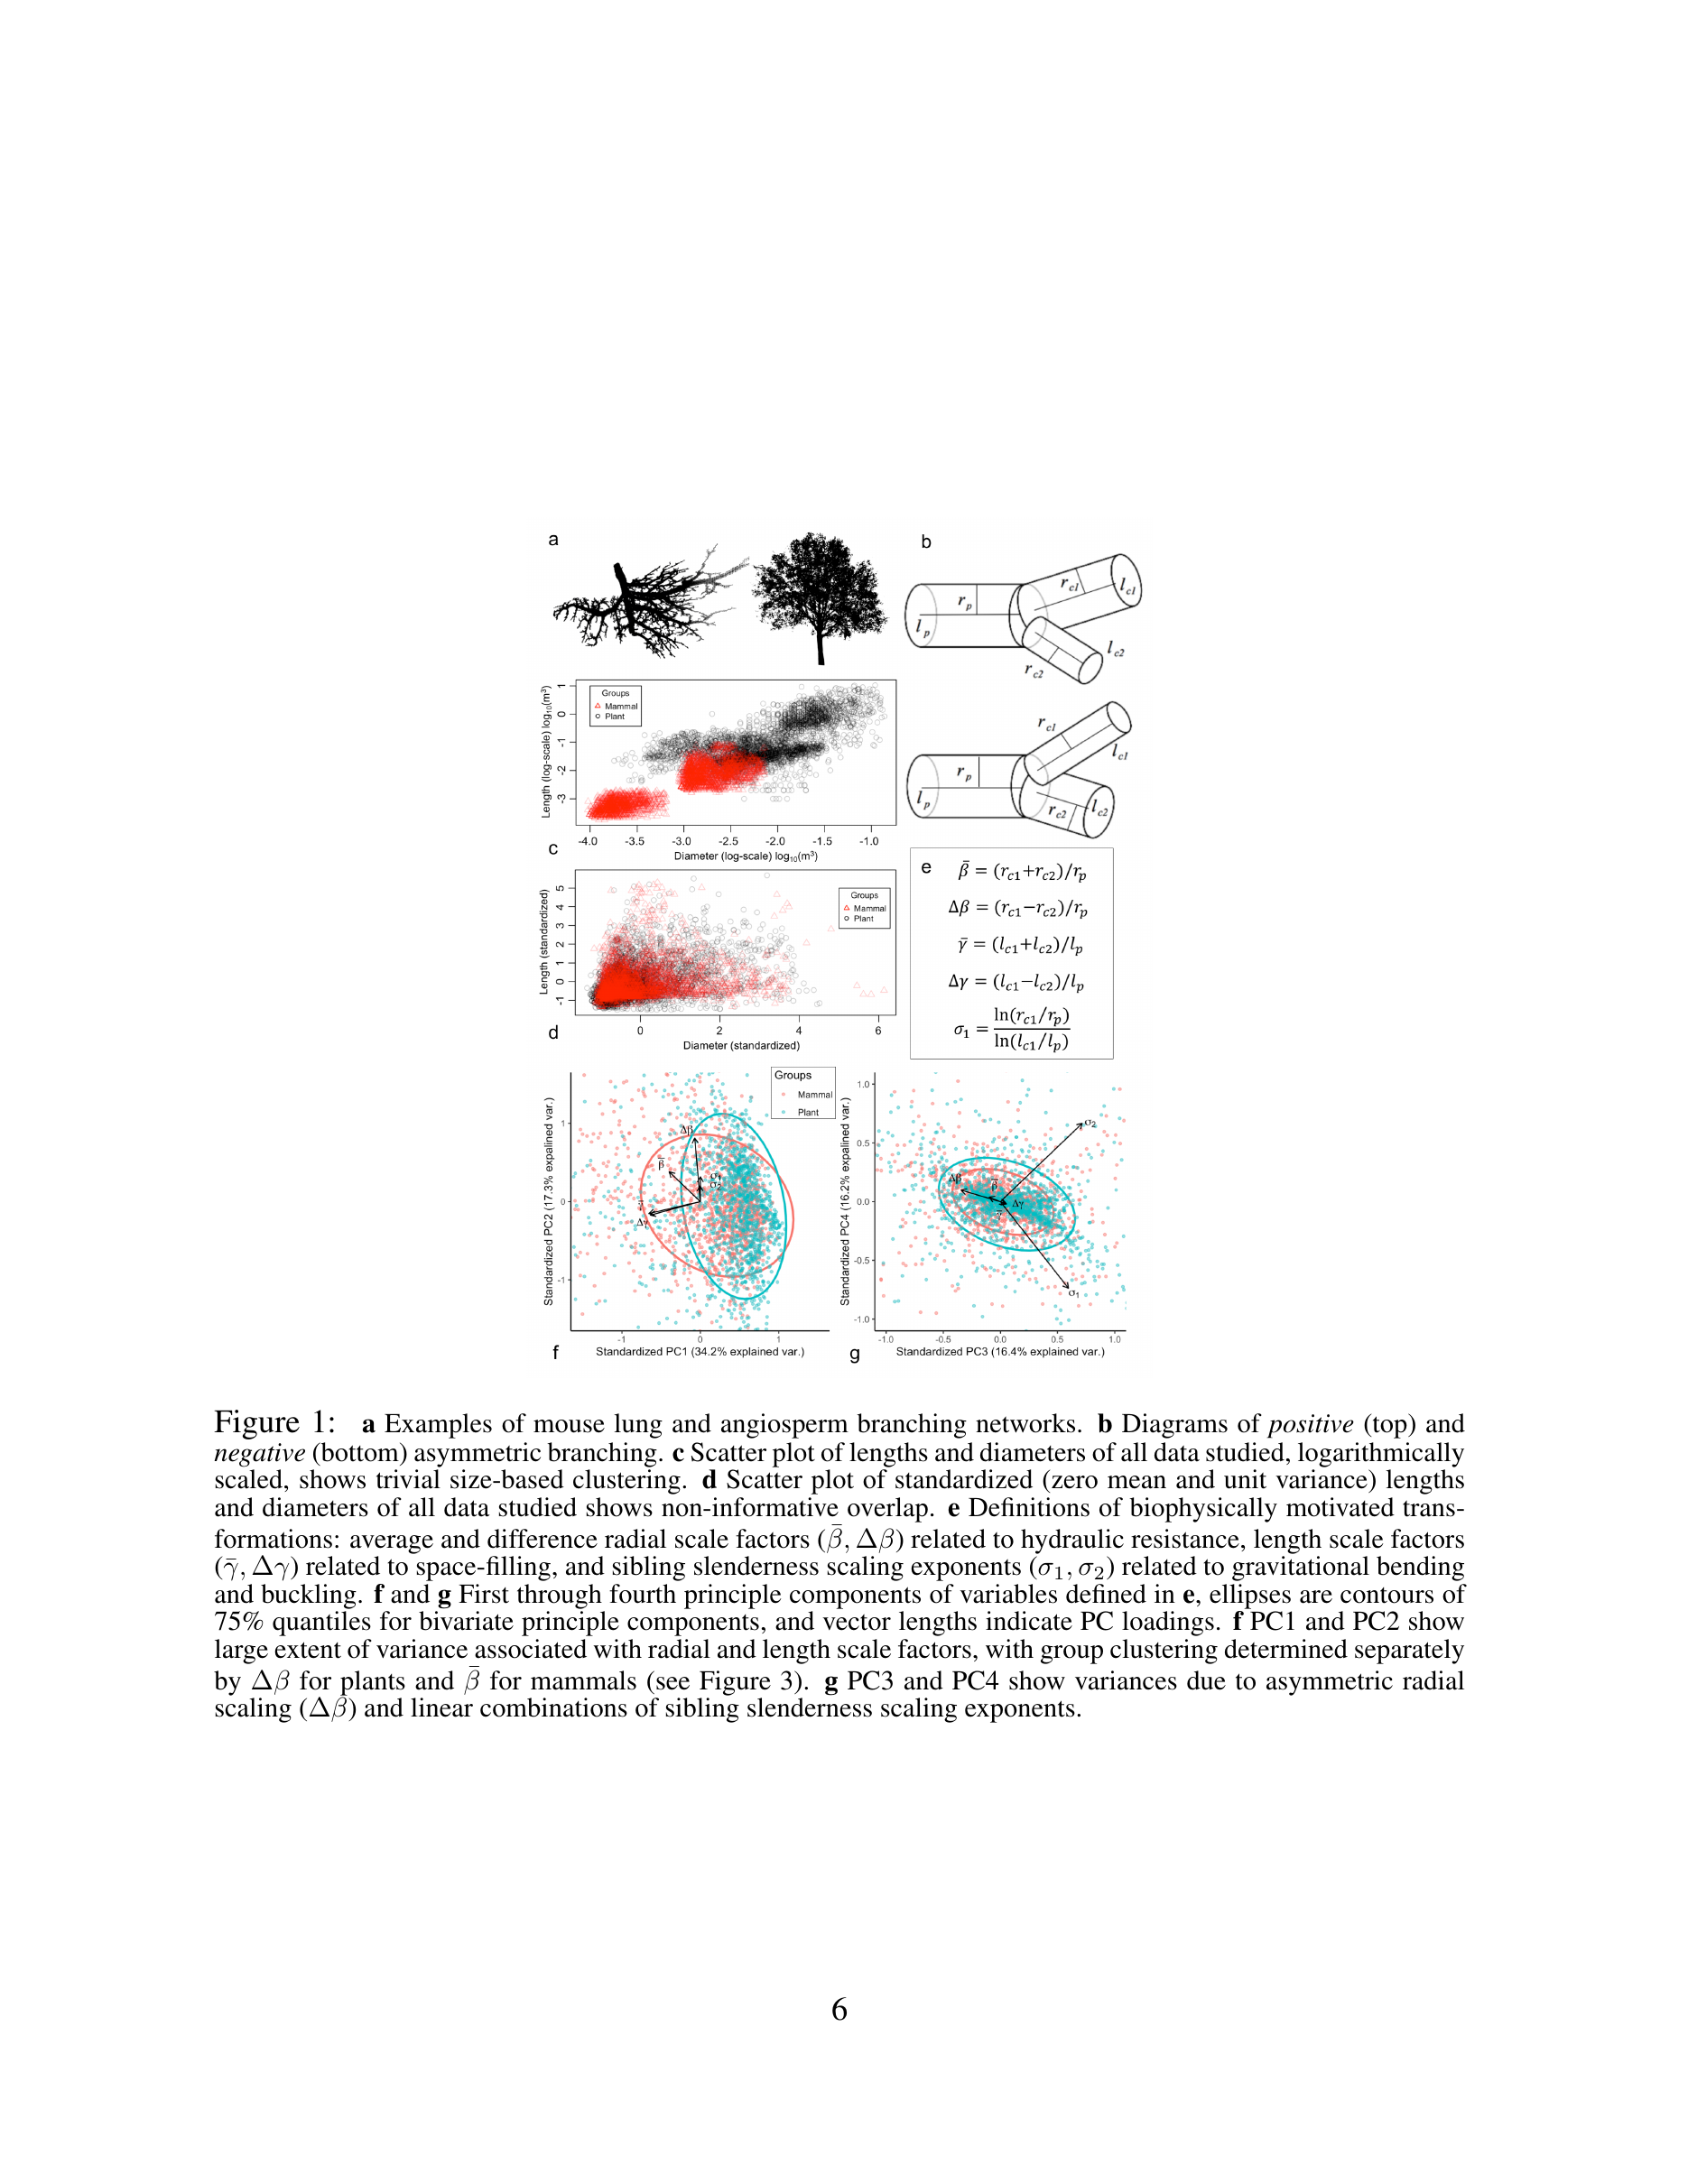
- Brummer et al. & Enquist (2021) — Branching principles of animal and plant networks identified by combining extensive data, machine learning and modelling. J. R. Soc. Interface.
Water flows upward through plant tissue under tension — leaves lose water to the air through transpiration, and that loss pulls a continuous column of water from soil to canopy. The path length from root tip to leaf sets total hydraulic resistance, and the tapering of conduit diameter from trunk to twig determines how resistance is distributed along the flow path. The West-Brown-Enquist vascular network model predicts that optimal tapering — minimizing total transport resistance while maintaining space-filling — generates the ¾-power metabolic scaling and the allometric relationships among stem diameter, height, and leaf area observed across plant life. Hydraulics is therefore not a module separate from metabolic scaling theory but a mechanistic foundation of it.
Enquist (2003) extended this reasoning to macroevolution, connecting Cope’s Rule — the recurrent evolutionary tendency toward larger body size across lineages — to directional selection favoring longer-distance water transport and the biomass partitioning trade-offs that accompany increasing plant size. Savage et al. (2010) demonstrated that introducing hydraulic trade-offs and space-filling constraints into the vascular network model substantially improves predictions of conduit structure and function across plant size classes. Smith et al. (2014) showed empirically that deviations from idealized symmetric self-similar branching carry simultaneous, predictable consequences for hydraulic efficiency, mechanical support, light interception, and metabolic scaling — revealing the multi-functional constraints under which real plant architectures evolve. Brummer et al. (2021) used machine learning and extensive branching data from both animal and plant networks to identify the shared geometric principles underlying biological transport networks, grounding plant hydraulic theory within a broader comparative framework.
BIEN: Botanical Information & Ecology Network
- Enquist et al. (2026) — BIEN: a global synthesis resource for Western Hemisphere plants. Methods Ecol. Evol.
- BIEN R package — programmatic access to occurrences, traits, ranges, and plot data.
- biendata.org — GeoSpatial portal and documentation.
![]()
Reliable biodiversity science requires reliable data — and that requires knowing where species have actually been recorded, how completely those records reflect reality, and whether the names attached to records refer to the same entity across time and region. The BIEN project addresses this at continental scale: it compiles and standardizes occurrence records, plant trait measurements, and vegetation plot data for vascular plants across the Western Hemisphere, making it one of the largest plant biodiversity synthesis efforts globally. The database integrates herbarium specimens, citizen-science observations, and plot inventories spanning roughly 1800s–present, with taxonomic reconciliation against a versioned plant name backbone and coordinate-level QA filtering that removes records with known georeferencing errors, cultivated provenance, or coordinate–country mismatches. The result is a synthesis resource that underpins macroecological analyses, SDM workflows, and trait-based forecasting at scales from regional to hemispheric (Enquist et al. 2026, Methods Ecol. Evol.).
Quick start: access BIEN data in R
```r install.packages("BIEN") library(BIEN) # Occurrence records for a species occ <- BIEN_occurrence_species("Pinus ponderosa") # Plant traits traits <- BIEN_trait_species("Quercus agrifolia") # Species range map range <- BIEN_ranges_load_species("Populus tremuloides") ``` Full docs: [BIEN vignette](https://cran.r-project.org/web/packages/BIEN/vignettes/BIEN.html) · [All lab tools](/resources/)Explore BIEN Species Data Interactively
Browse occurrence records and range maps for ~120,000 Western Hemisphere plant species — filter by native status, political unit, and elevation, then download georeferenced records and range polygons directly from the app.
Open BIEN Species Explorer in a new tab →
BIEN Interactive Apps
Browse occurrence records and range maps for ~120,000 Western Hemisphere plant species. Filter by native status, political unit, and elevation; download georeferenced records and range polygons.
GitHub README
Query, map, and export plant functional trait observations from the BIEN trait database. Supports multi-species input, trait-level coverage preview, mapped observations, and reproducible R export code with full provenance and citation metadata.
GitHub README
Upload a species list to retrieve, review, and bulk-export BIEN occurrence and trait data. Designed for batch queries and downstream biodiversity analysis workflows.
GitHub README
Forecasting Biodiversity Under Global Change
- Boonman et al. (2024) — 17,000+ tree species at risk from rapid global change. Nature Communications
- Pillet et al. (2022) — Elevated extinction risk of cacti under climate change. Nature Plants
- Moulatlet et al. (2025) — Climatic niche breadth predicts plant range size globally. PNAS
- Serra-Diaz et al. (2024) — occTest: systematic QA of species occurrence data. Global Ecol. Biogeogr.
Species and communities do not experience climate change only in the future — they are experiencing it now. Range edges are already contracting and shifting, functional compositions are already changing, and species in some regions are already encountering climates with no historical analogue in their evolutionary experience. Translating these ongoing changes into defensible projections requires integrating occurrence data, trait information, and climate forcing within models that are explicit about their assumptions and honest about the limits of their predictions.
What we have found. Applying species distribution models to the global tree flora, Boonman et al. (2024) (Nature Communications) estimated that more than 17,000 tree species — roughly 30% of all tree species globally — face elevated risk under business-as-usual emissions, with tropical and island taxa disproportionately affected. A companion analysis (Boonman et al. 2025, PNAS) found that even under the most optimistic mitigation scenario, a substantial fraction of tree diversity will be exposed to macroclimatic conditions unprecedented in their evolutionary history — meaning extrapolation beyond calibration space is unavoidable regardless of emission pathway. Taxon-specific analyses sharpen the picture: Pillet et al. (2022) (Nature Plants) showed that more than 60% of cactus species face elevated extinction risk, with arid-land endemics experiencing the sharpest projected range contractions. Moulatlet et al. (2025) (PNAS) connected climatic niche breadth to range size and ecological dominance across the global plant flora, establishing a mechanistic basis for why narrow-niche specialists are disproportionately vulnerable.
Uncertainty, transferability, and data quality. All projections in this lab are conditional on the emission scenario assumed, the overlap between calibration and future climate space, and the quality of underlying occurrence data. We use similarity surfaces (MESS) to flag where projections extend beyond training-climate space; results in extrapolation zones are reported with explicit uncertainty ranges rather than treated as equivalent to interpolations. Occurrence data pass through occTest (Serra-Diaz et al. 2024, GEB), a multi-test quality control pipeline that removes coordinate errors, duplicates, and records inconsistent with known ecological context. We apply spatial thinning, bias layers, and target-group background sampling to mitigate the spatial overrepresentation of well-surveyed regions endemic to herbarium and citizen-science datasets. Models are validated against temporal holdouts and independent regional data where available.
Forward look. The next generation of biodiversity forecasting moves from correlative SDMs toward mechanistically constrained projection — integrating trait-based models that predict which functional types persist under novel climates with demographic models capturing lag effects and dispersal limitation. Current BIEN data synthesis (Enquist et al. 2026, Methods Ecol. Evol.) provides the occurrence and trait data platform for this integration across the Western Hemisphere.
Collaborative Initiatives
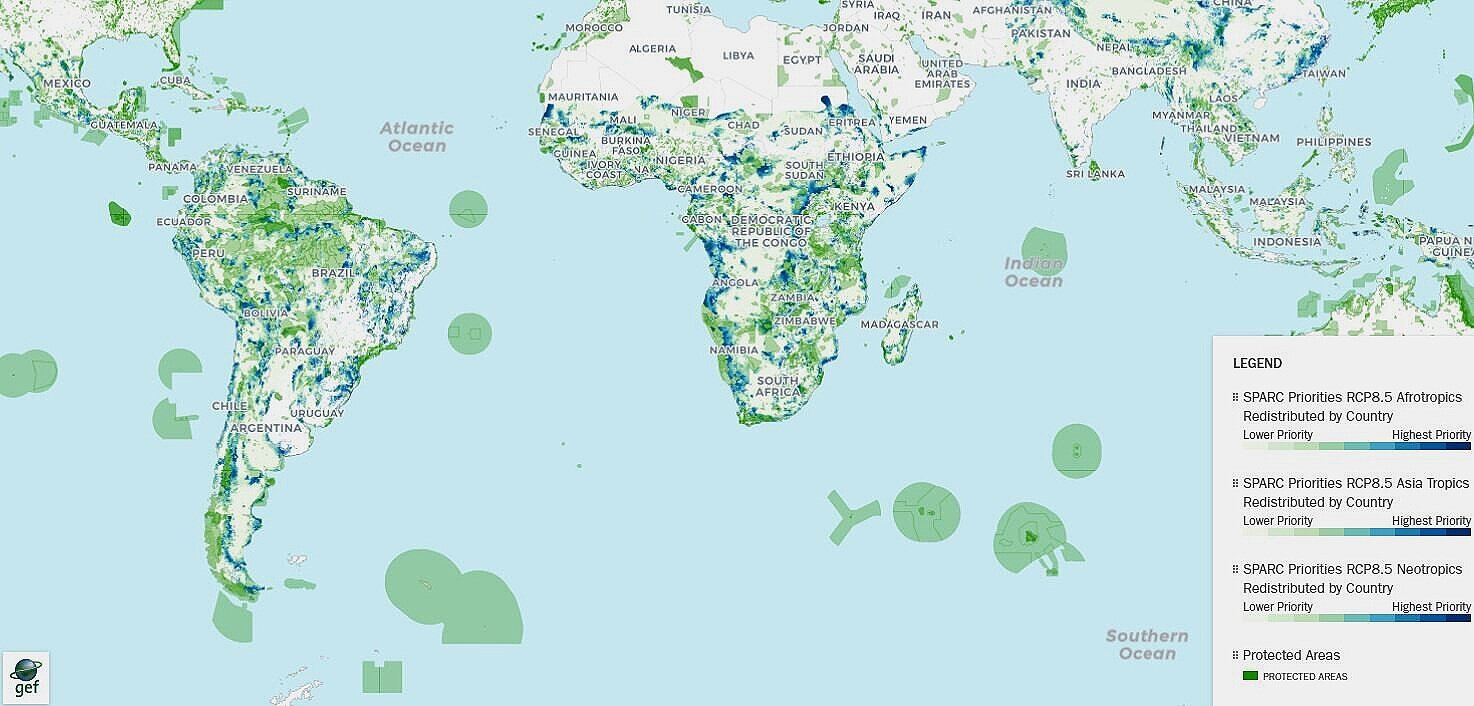
We actively collaborate with local and international initiatives that support field work, synthesis, and training for students, postdocs, and collaborators. These collaborations include biodiversity forecasting and conservation planning efforts, including SPARC and related protected-area prioritization projects.
See collaborators for examples.
Long-Term Ecology

- Bektas et al. (2024) — TransPlant Network design and protocols. Ecography
- Swenson, Hulshof, Katabuchi & Enquist (2020) — 30-year functional diversity shifts in tropical dry forest. Ecol. Monogr.
- Sloat et al. (2015) — Foresummer drought and alpine carbon uptake. Ecosystems
- Field Sites page →
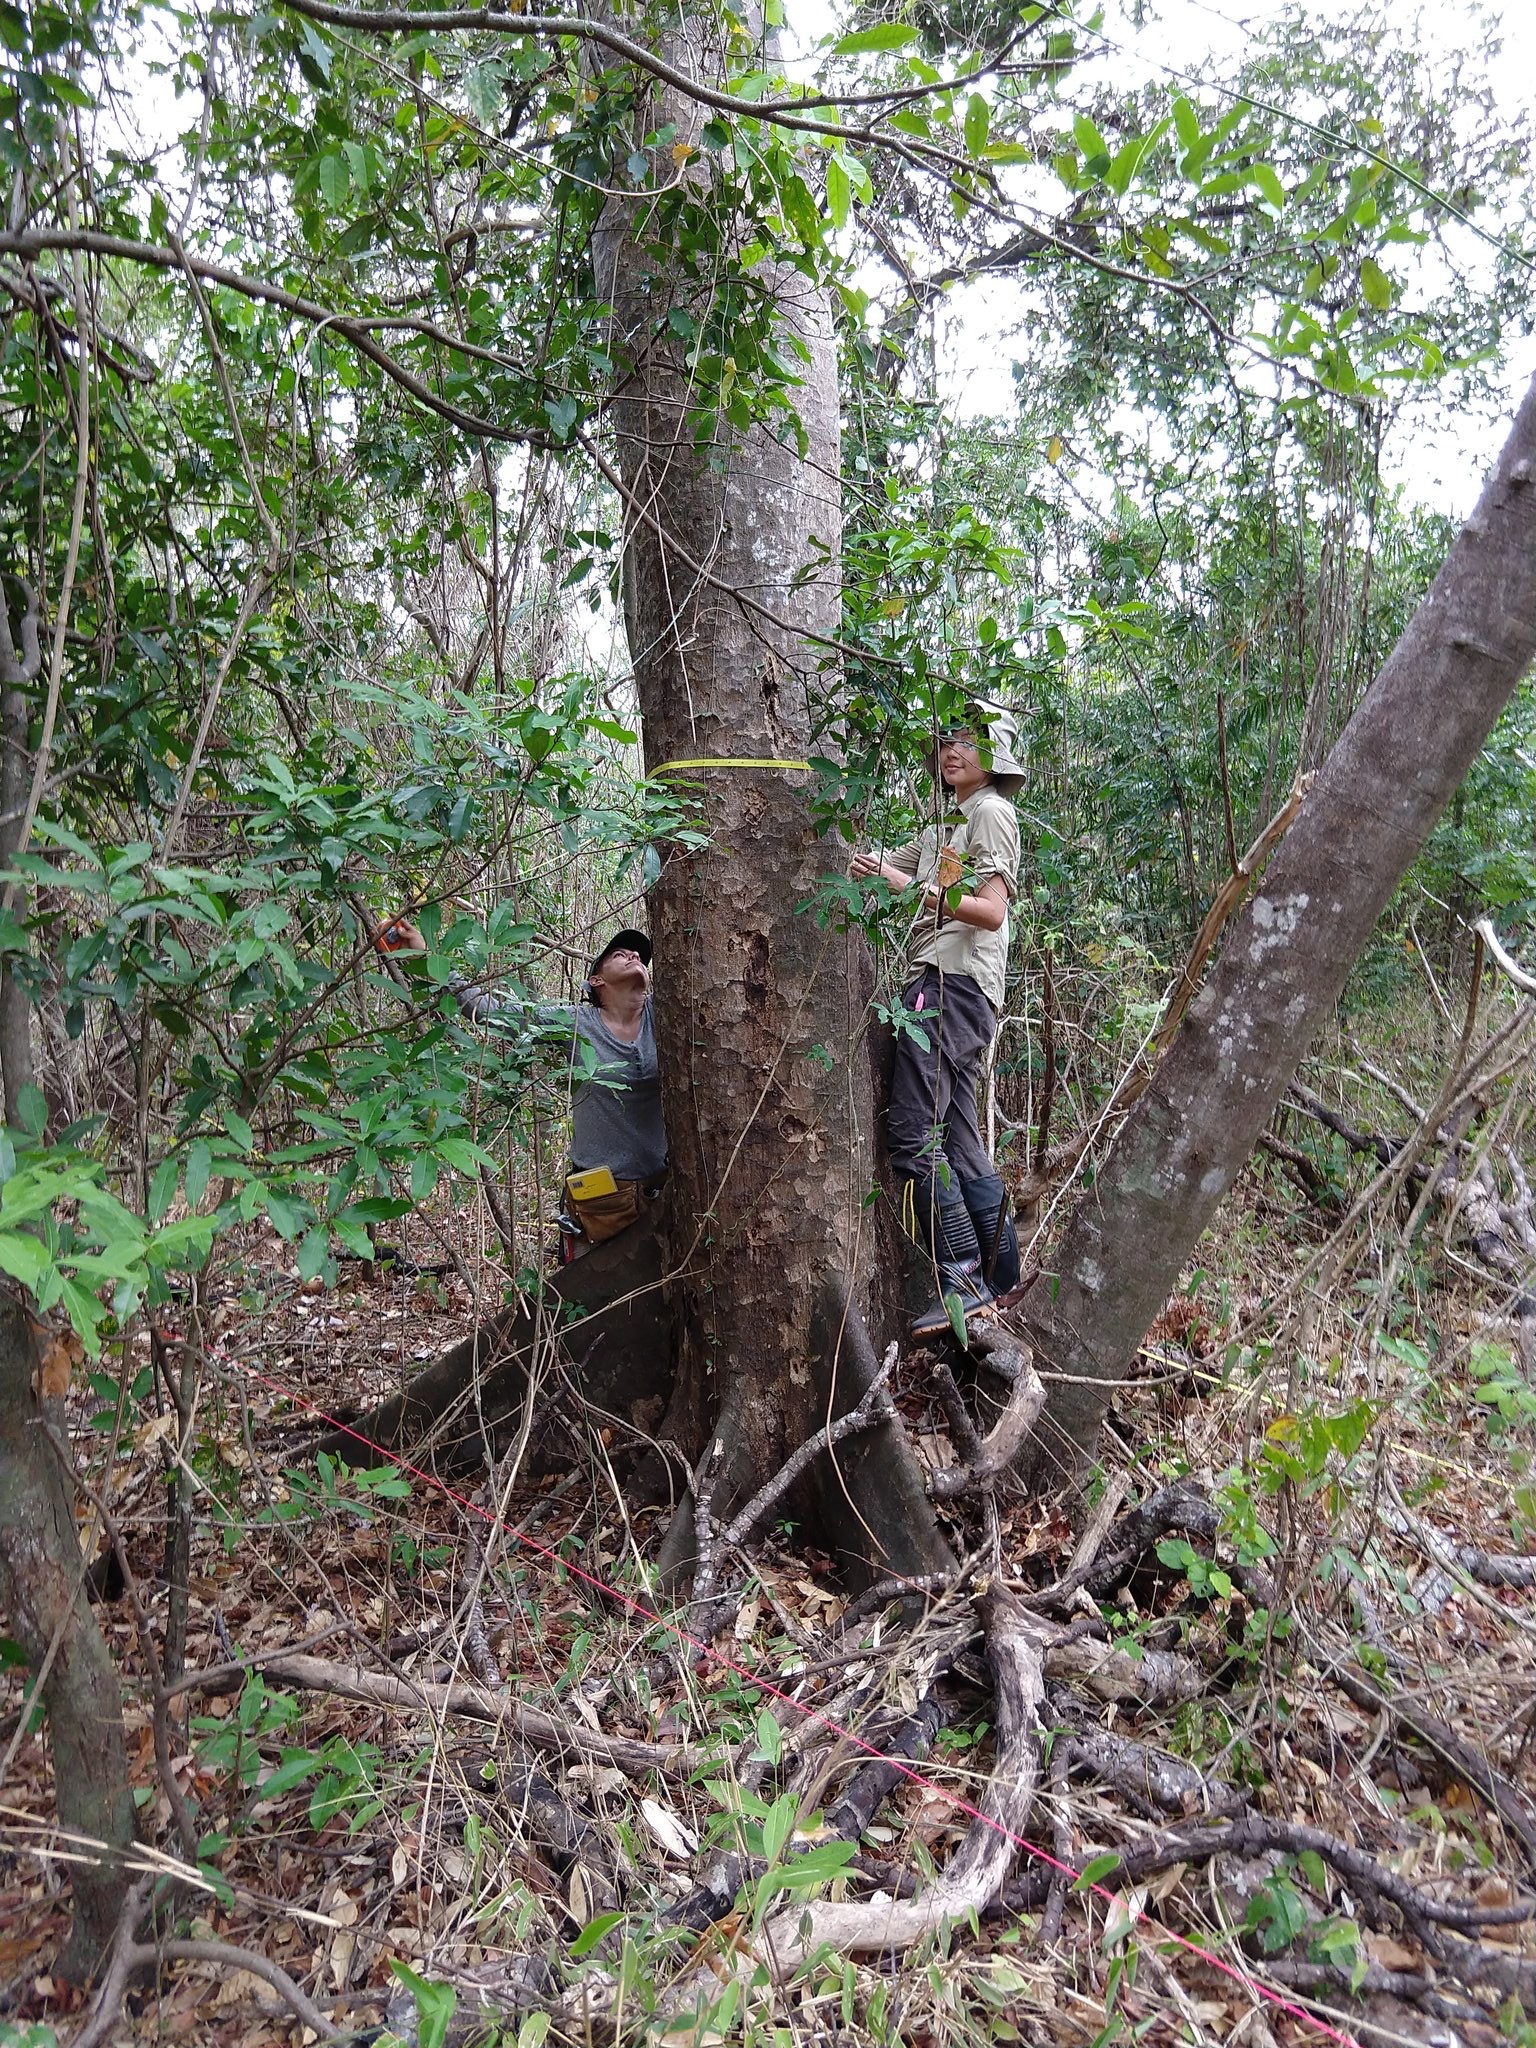
Ecological understanding limited to snapshot comparisons across space cannot reliably separate the signal of climate change from the noise of local history, soil variation, and community assembly. Long-term repeated measurements at fixed sites provide the temporal leverage needed to detect genuine change, test process-based predictions, and validate models built on space-for-time substitutions. The lab has invested in this infrastructure across three complementary systems: a tropical dry forest dynamics plot running since the 1970s, a temperate montane monitoring transect operating since 2003, and a whole-community climate change experiment embedded in a global transplant network.
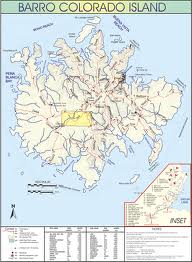
San Emilio Forest Dynamics Plot (SEFDP). The SEFDP in Santa Rosa National Park, Area de Conservación Guanacaste, Costa Rica, is among the oldest and largest tropical forest dynamics plots in the Western Hemisphere and a member of the ForestGEO global network. First censused by Stevens and Hubbell in 1976 (~15 ha, ~50,000 stems, ~200 woody species), the plot has been fully resurveyed in 1995–96, 2006–07, and most recently 2019–2021, generating a nearly 50-year record through repeated El Niño droughts and disturbance cycles in a seasonally dry tropical system. Analysis of this record has revealed that community responses to drought and historical disturbance are strongly non-uniform across functional types: drought-tolerant and drought-sensitive assemblages diverge on different compositional trajectories, confounding predictions based on mean community shifts alone. Swenson, Hulshof, Katabuchi, & Enquist (2020) (Ecol. Monogr. 90:e01408) documented systematic shifts in functional composition and diversity across three decades, implicating long-term climate forcing on top of disturbance legacies — one of the most temporally resolved records of functional change in any tropical system.
RMBL montane gradient. Since 2003 the lab has monitored ecosystem carbon fluxes, species composition, and functional trait distributions across an elevational gradient at the Rocky Mountain Biological Laboratory in Gothic, Colorado. Work from this system revealed that the foresummer drought — the period of low soil moisture between snowmelt and summer monsoon rains — is a key driver of year-to-year variation in ecosystem carbon uptake, with community composition mediating sensitivity (Sloat et al. 2015, Ecosystems 18:533).
RMBL Transplant Project and TransPlant Network. Beginning in 2017, intact 0.5 m² meadow turf blocks — vegetation and soil together — were moved ±400 m along an elevational gradient in Washington Gulch, simulating rapid climate warming or cooling under field conditions. Because the community structure and soil biota move intact, confounding factors that plague observational gradient studies are minimized. The experiment is embedded within the TransPlant Network (Bektas et al. 2024, Ecography) — 22 elevation gradients across 20 mountainous regions of the Northern Hemisphere — enabling cross-biome meta-analysis of how warming restructures plant functional diversity, productivity, and ecosystem carbon balance.

OpenTraits & Biodiversity Informatics
The Enquist Lab is a co-founding member and active contributor to the Open Traits Network (OTN) — a global, decentralized community of researchers and institutions working to standardize and integrate trait data across all organisms. OTN is guided by Open Science principles: open methods, open source, and open data.
What the OTN does. The network maintains a global registry of trait-based initiatives, shares reproducible workflows and tools for aggregating trait data, advocates for free data flow and appropriate attribution of effort, and works toward a shared trait core — a minimal interoperable vocabulary that facilitates synthesis across databases. The registry currently spans hundreds of datasets, covering plants, animals, fungi, and microbes across all biomes.
Our contributions and roles. Lab members have contributed to OTN in multiple capacities:
- Co-authoring the network’s foundational paper: Gallagher et al. (2020) Nature Ecology & Evolution — introducing OTN and its open-science vision for trait data across all life.
- Best-practice guidance: Enquist is a contributing author on Keller et al. (2023) Methods in Ecology and Evolution — “Ten (mostly) simple rules to future-proof trait data in ecological and evolutionary sciences” — an open, community-driven resource now hosted at opentraits.org/best-practices.html.
- Tool development: Contributing to
traitdataformandtraitstrapfor standardized trait formatting and bootstrap-based trait gap-filling. - Data pipelines: Building interoperable ingestion workflows that connect BIEN, TRY, FRED, and other databases into OTN-compatible formats with full provenance tracking.
Five OTN principles the lab practices:
- Openly sharing data, methods, protocols, code, and workflows
- Appropriately citing original data collectors and providing scholarly credit
- Providing full metadata alongside trait observations
- Collecting trait data following reproducible, standardized methods
- Providing training resources in trait collection and database construction
Key connected databases. The lab’s biodiversity informatics work connects across a growing ecosystem of open trait and occurrence resources:
| Resource | Scope |
|---|---|
| TRY Plant Trait Database | Global plant traits, >15M records |
| BIEN | Neotropical plant occurrence and traits |
| FRED | Fine-root traits across ecosystems |
| GBIF | Global biodiversity occurrence records |
| GIFT | Plant species richness and functional traits |
| OTN Dataset Registry | Cross-taxon trait database catalog |
Biodiversity informatics more broadly. Beyond trait databases, the lab contributes to informatics infrastructure for ecological synthesis: Darwin Core extensions for trait data, quality-control pipelines for taxonomic reconciliation, and open workflows connecting field observations to continental-scale synthesis products. This infrastructure underpins our forecasting work through BIEN and enables reproducible, uncertainty-aware macroecology at global scale.