tools & data
Open-source tools and databases from the Enquist Lab
Software & Open Data
Code and public tools associated with current and ongoing lab projects.

Lab software and open data products are built from the same pipeline: field observations, curated synthesis databases, and decision-oriented ecological analyses.
Lab Resources
PFTC Resources
The Plant Functional Trait Courses are a major training pipeline for the lab’s field-based trait ecology work. They combine hands-on sampling, data curation, community ecology, and quantitative analysis across diverse field settings.
PFTC Website
Course overview, field locations, and program context.
Teaching Material
Central course documentation and open teaching modules.
Working With PFTC Data
Data structure, workflow, and analysis orientation for course datasets.
Data Curation
Cleaning, documentation, and QA practices for trait datasets.
Community And Sampling Data
Plot structure, community measurements, and sampling design guidance.
Plant Functional Trait Data
Trait definitions, measurement protocols, and interpretation notes.
PFTC Lectures
Lecture archive covering methods, theory, and field applications.
BIEN: Botanical Information & Ecology Network
![]()
The BIEN project compiles and standardizes occurrence records, trait measurements, and plot data for vascular plants of the Western Hemisphere — one of the largest plant biodiversity synthesis efforts globally. The database integrates herbarium specimens, citizen-science observations, and plot inventories spanning roughly 1800s–present, with taxonomic reconciliation against a versioned plant name backbone and coordinate-level QA filtering (Enquist et al. 2026, Methods in Ecology and Evolution).
BIEN R Package
The BIEN R package provides programmatic access to ~85 million botanical observations, ~100,000 species range maps, and plant trait data for the New World.
install.packages("BIEN")
library(BIEN)
sp <- BIEN_occurrence_species("Pinus ponderosa")
BIEN Data Portal & Interactive Apps
The BIEN GeoSpatial portal provides web-based access to New World plant occurrence, range, and trait data with QA/QC, taxonomic harmonization, and geographic filtering. Three focused Shiny apps extend portal access for specific workflows:
Browse occurrence records and range maps for ~120,000 Western Hemisphere plant species. Filter by native status, political unit, and elevation; download georeferenced records and range polygons.
GitHub README
Query, map, and export plant functional trait observations. Supports multi-species input, coverage preview, mapped observations, and reproducible R export code with full provenance metadata.
GitHub README
Upload a species list to retrieve, review, and bulk-export BIEN occurrence and trait data. Designed for batch queries and downstream biodiversity analysis workflows.
GitHub README
BIEN Web Services
These services form a complete biodiversity data QA pipeline from taxonomic names to geographic context:
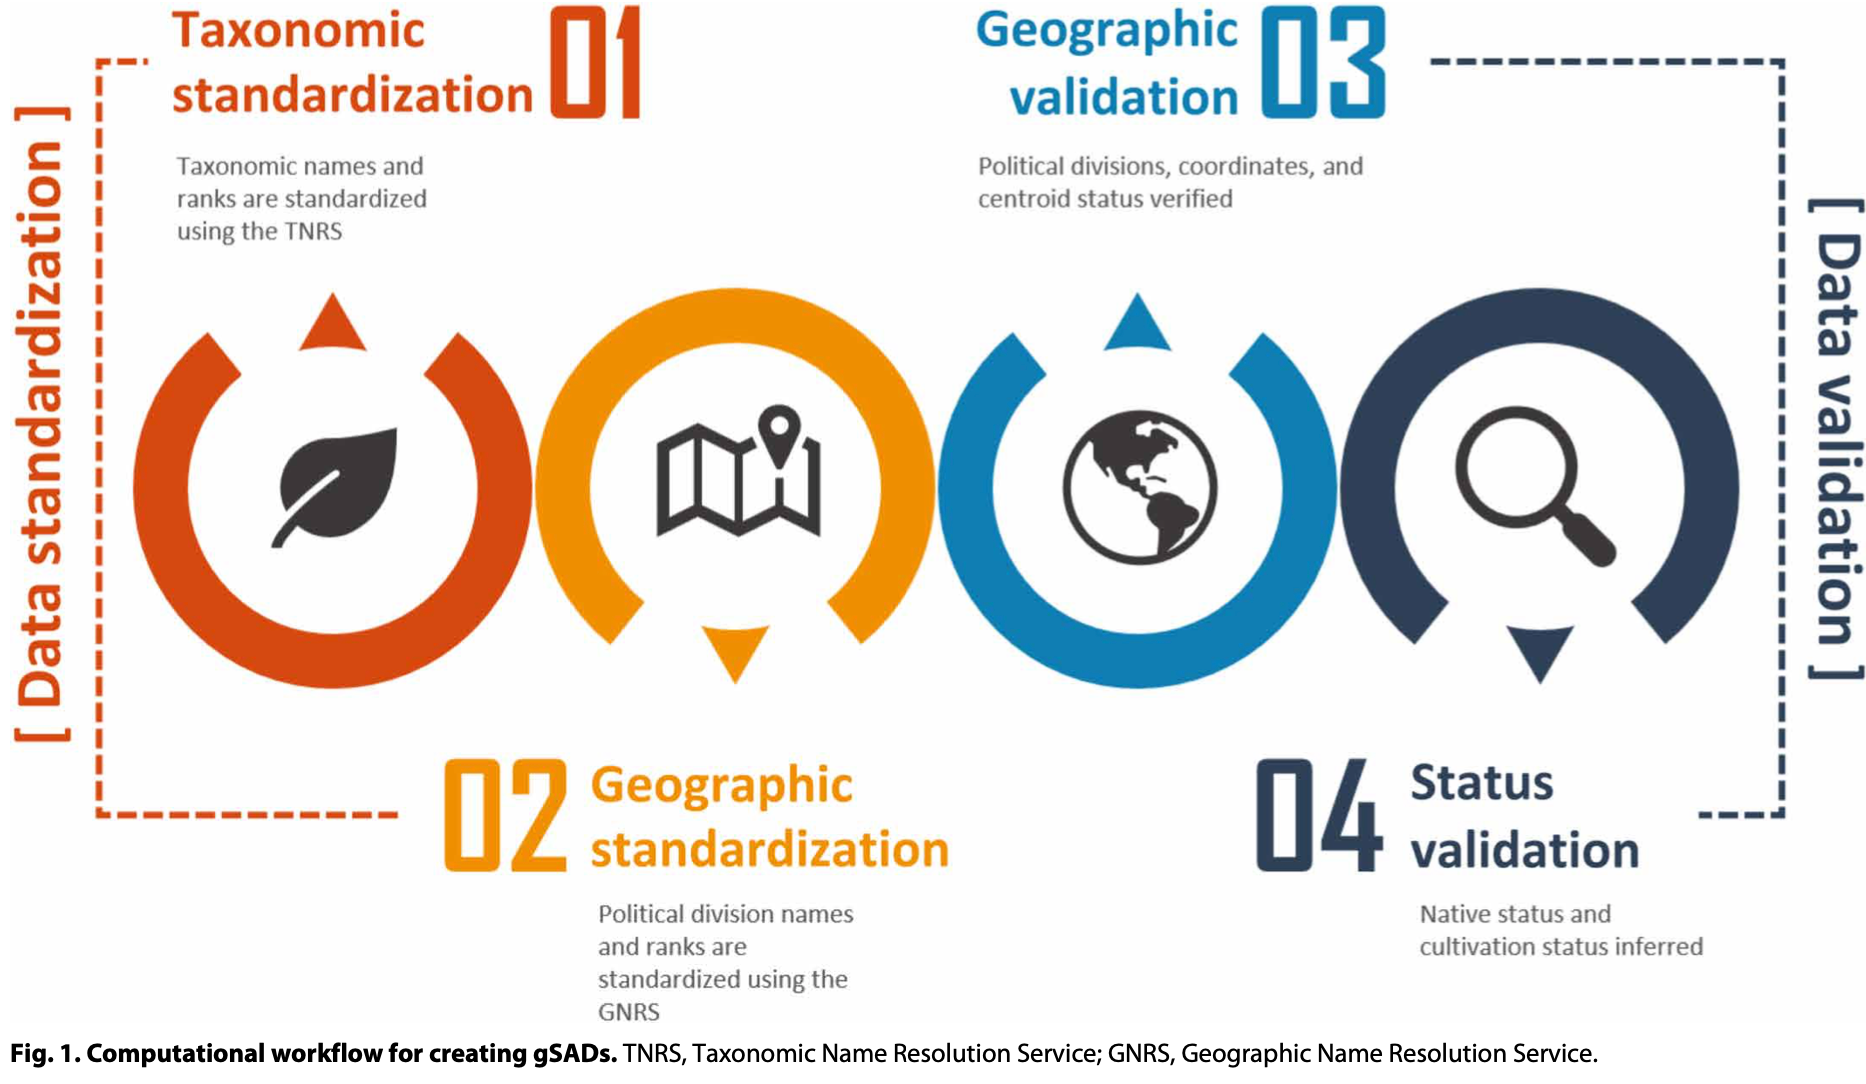
TNRS
Taxonomic Name Resolution Service
GNRS
Geographic Name Resolution Service
NSR
Native Species Resolver
GVS
Geocoordinate Validation Service
- TNRS — Taxonomic Name Resolution Service
- Computer-assisted standardization of plant scientific names: corrects spelling errors, resolves synonyms, and maps names to accepted taxonomy. GitHub source · Featured in Nature (2011) · Boyle et al. (2013), BMC Bioinformatics
- GNRS — Geographic Name Resolution Service
- Standardizes political division names (country, state/province, county) against authoritative gazetteers, enabling consistent geographic filtering and data integration across sources. Boyle et al. (2022), PLOS ONE
- NSR — Native Species Resolver
- Uses regional taxonomic checklists to determine whether observations of a species within a political division are native, introduced, or cultivated. Legacy tool page
- GVS — Geocoordinate Validation Service
- Validates and corrects geocoordinates, flags implausible locations, and returns standardized political context for each point.
R Vignettes
co2fluxtent
An R package developed by Enquist Lab collaborators for processing CO₂ and H₂O flux measurements from open-path flux tent deployments. Complements fluxible (which targets closed-loop chamber systems) by providing a workflow tailored to open-path configurations, including concentration–time curve fitting with AIC-based model selection, H₂O flux parsing, quality screening, and standardized flux output suitable for multi-site comparisons.
- GitHub: PaulESantos/co2fluxtent
# Install from GitHub
remotes::install_github("PaulESantos/co2fluxtent")
library(co2fluxtent)
traitstrap
Bootstraps trait distributions to propagate uncertainty from individual-level measurements to community-weighted means and higher-order community trait statistics. Addresses a key challenge in trait-based ecology: raw community-weighted mean (CWM) calculations ignore intraspecific trait variation and sampling uncertainty. traitstrap implements parametric bootstrapping that draws from species-level trait distributions, weighted by abundance, producing CWMs with full uncertainty quantification suitable for downstream modeling.
Works directly with trait data from BIEN, TRY, and comparable databases, and is designed to integrate with the lab’s Trait Driver Theory framework (Enquist et al. 2015; Šímová & Enquist 2017).
- CRAN: traitstrap
- GitHub: Plant-Functional-Trait-Course/traitstrap
- Citation: Maitner, B. S., et al. (2023). On the utility of the community-weighted mean of trait distributions. Methods in Ecology and Evolution, 14(7), 1706–1714. https://doi.org/10.1111/2041-210X.14160
- Vignette: traitstrap vignette
install.packages("traitstrap")
library(traitstrap)
netassoc
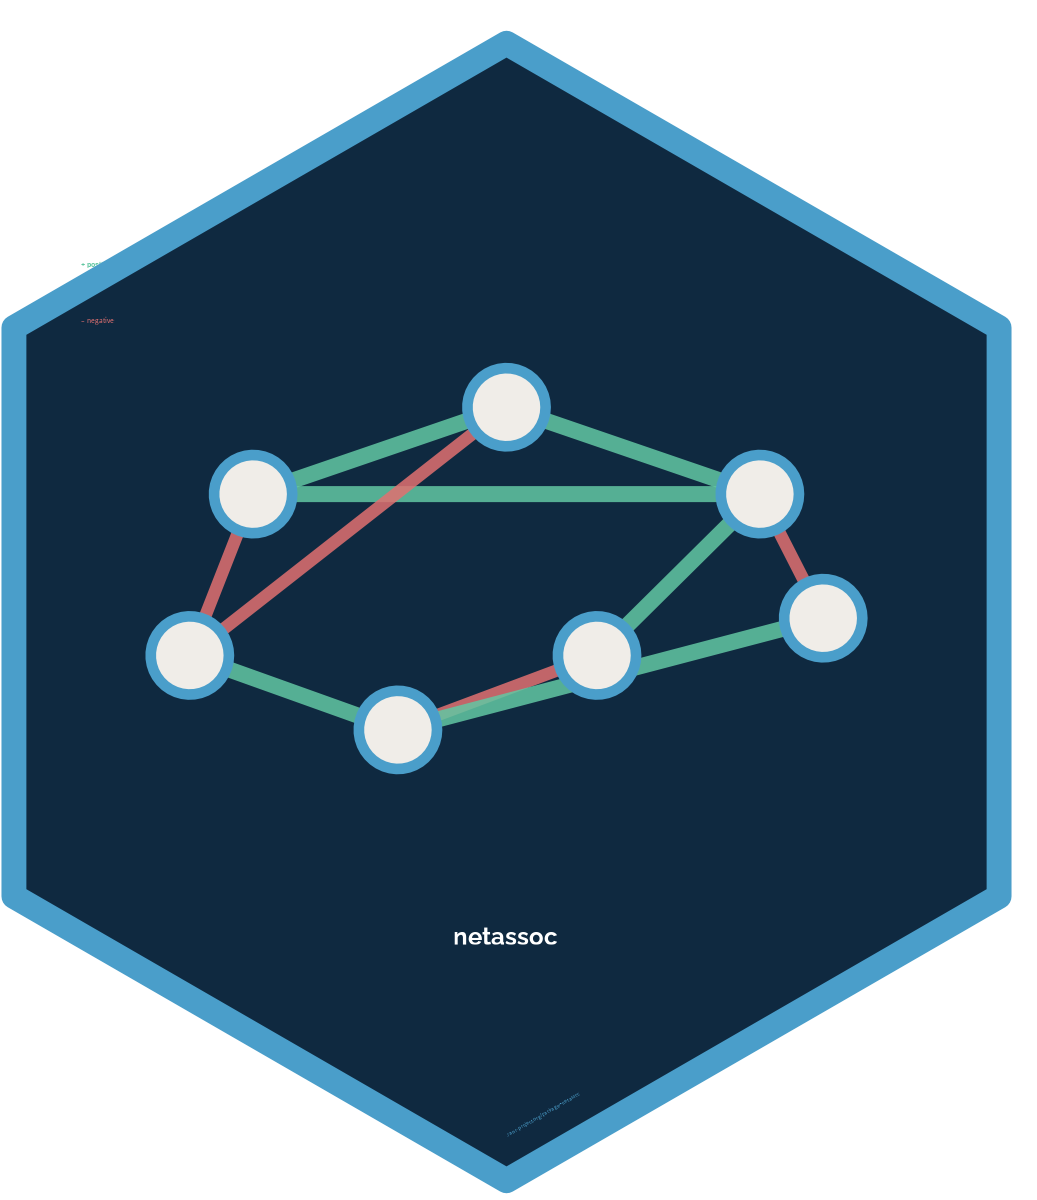
Infers species associations from community co-occurrence matrices using partial correlations and Gaussian graphical models. Null modeling controls for shared abundance structure and species richness, isolating true biotic signal from sampling artefacts. Returns a signed species association network with positive (co-occurrence above null expectation) and negative (segregation below null expectation) edges, suitable for downstream network analysis and community assembly inference.
- CRAN: netassoc
- Citation: Morueta-Holme, N., Blonder, B., Sandel, B., McGill, B. J., Peet, R. K., Ott, J. E., Violle, C., Enquist, B. J., Jørgensen, P. M., & Svenning, J.-C. (2016). A network approach for inferring species associations from co-occurrence data. Ecography, 39(12), 1139–1150. https://doi.org/10.1111/ecog.01892
comclim
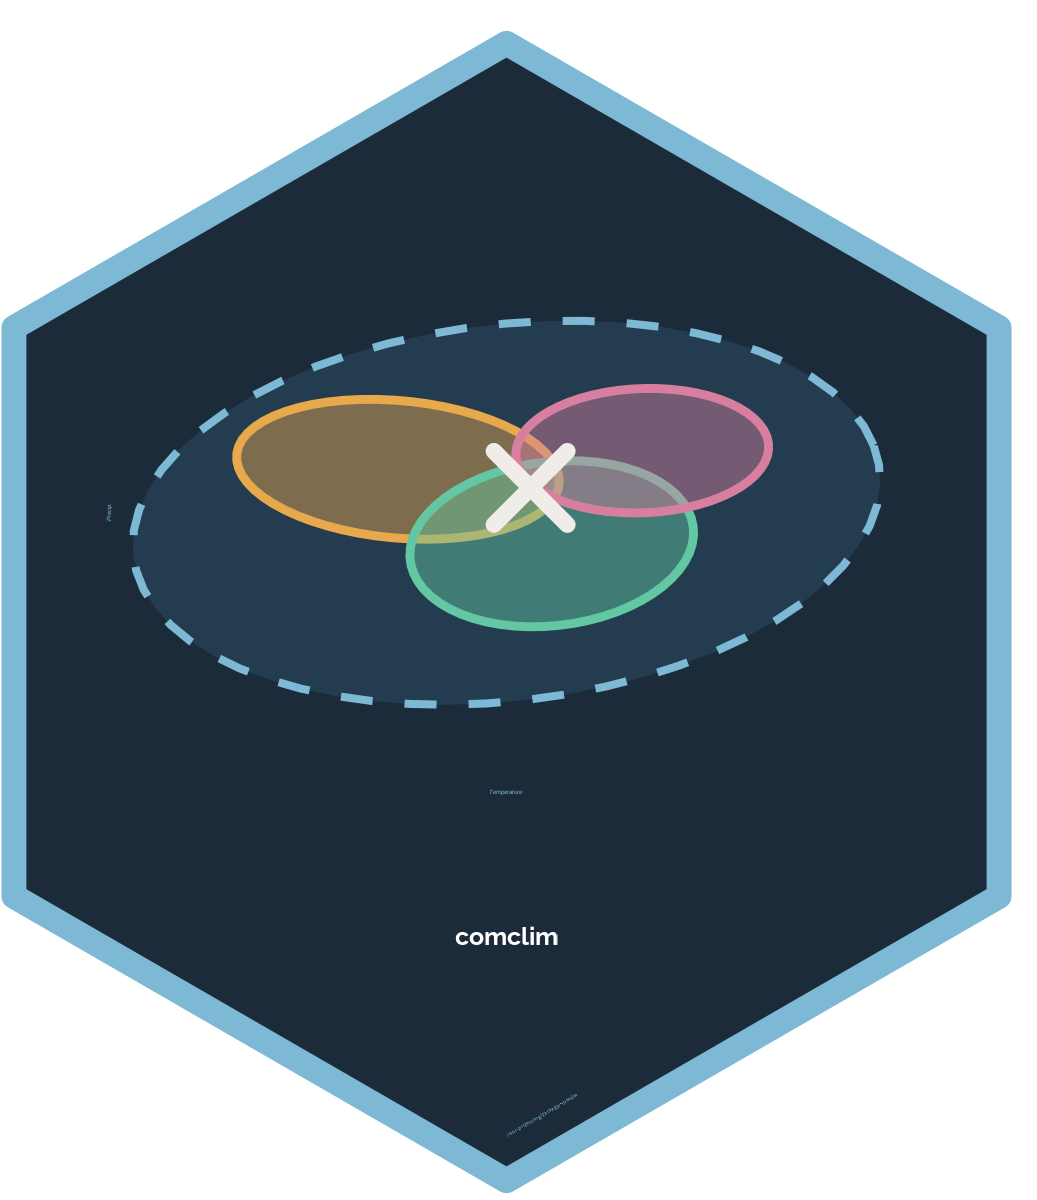
Computes community climate statistics for volume and mismatch using species’ climate niches, either unscaled or scaled relative to a regional species pool. Used to describe biogeographic patterns and infer community assembly processes.
- CRAN: comclim
- Citation: Blonder, B., Nogués-Bravo, D., Borregaard, M. K., Donoghue II, J. C., Jørgensen, P. M., Kraft, N. J. B., Lessard, J.-P., Morueta-Holme, N., Sandel, B., Svenning, J.-C., Violle, C., Rahbek, C., & Enquist, B. J. (2015). Linking environmental filtering and disequilibrium to biogeography with a community climate framework. Ecology, 96(4), 972–985. https://doi.org/10.1890/14-0589.1
hypervolume
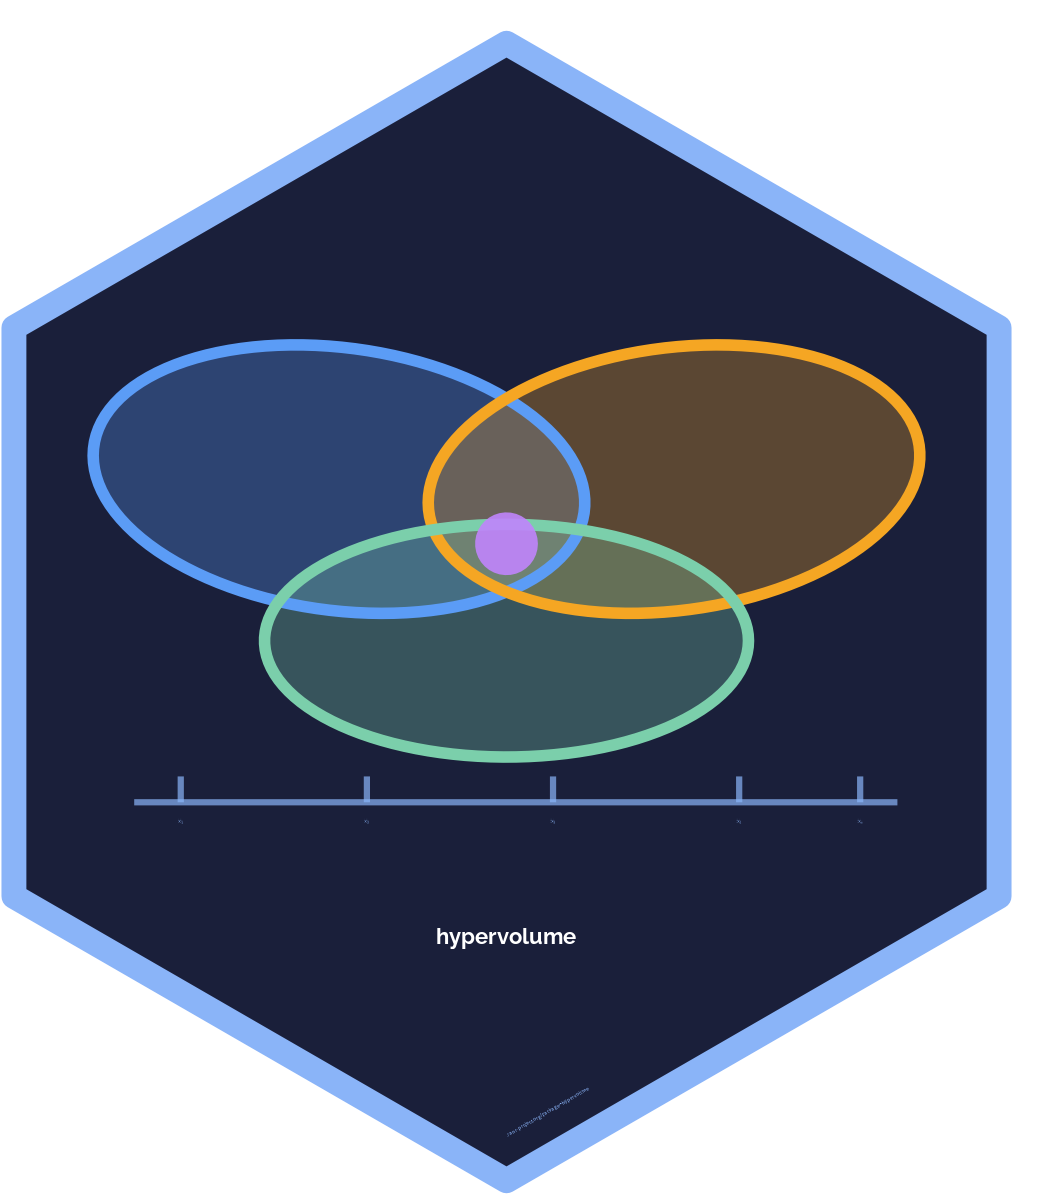
Estimates the shape and volume of high-dimensional ecological objects (niches, trait distributions) and performs set operations including intersection, union, and overlap. Used for n-dimensional niche quantification, trait-space analysis, and set operations on ecological hypervolumes.
- CRAN: hypervolume
- Citation: Blonder, B., Lamanna, C., Violle, C., & Enquist, B. J. (2014). The n-dimensional hypervolume. Global Ecology and Biogeography, 23(5), 595–609. https://doi.org/10.1111/geb.12146
fluxible
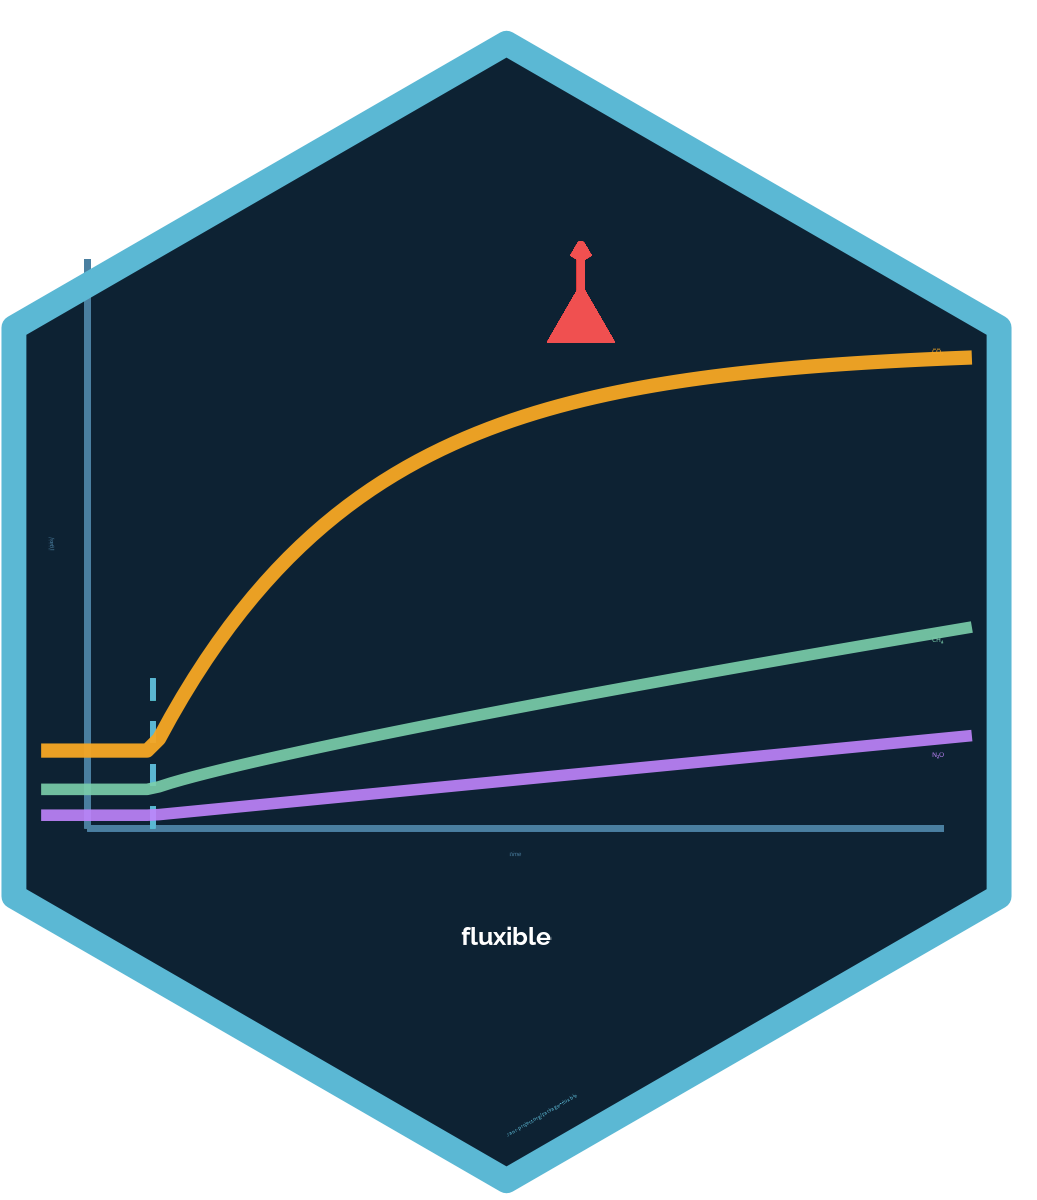
Processes raw gas concentration data from closed-loop chambers into analysis-ready ecosystem gas flux datasets in an automated and reproducible way. Handles CO₂, CH₄, and N₂O flux data, with core functions for flux calculation from raw concentration–time curves, automatic detection of non-linear or problematic measurements, outlier flagging, and export of QA-annotated summaries.
Pairs naturally with the lab’s long-term ecosystem monitoring work at sites including RMBL and tropical elevational transects.
- CRAN: fluxible
- GitHub: jogaudard/fluxible
- Citation: Gaudard, J., Telford, R. J., Chacón-Labella, J., Dawson, H. R., Enquist, B. J., Töpper, J. P., Trepel, J., Vandvik, V., Baumane, M., Birkeli, K., Holle, M. J. M., Hupp, J. R., Santos-Andrade, P. E., Satriawan, T. W., & Halbritter, A. H. (2025). fluxible: An R package to process ecosystem gas fluxes from closed-loop chambers in an automated and reproducible way. Methods in Ecology and Evolution, 16(11), 2560–2568. https://doi.org/10.1111/2041-210X.70161
Plant-O-Matic
Open software integrating biodiversity layers with mobile APIs to deliver plant identification and occurrence information.
- Citation: Enquist et al. (2016) Methods in Ecology and Evolution
- GitHub
OpenTraits Network
![]()
The Open Traits Network (OTN) is a global, decentralized community of researchers and institutions working to standardize and integrate functional trait data across all organisms — from plants and animals to fungi and microbes. The Enquist Lab is a co-founding member and active contributor to OTN, and co-leads efforts to establish data-quality standards, FAIR data principles, and open workflows for trait synthesis across the Tree of Life.
OTN operates as an open science community: methods, tools, and data are made publicly available to lower barriers to entry and accelerate cross-taxon synthesis. The network aggregates trait databases (including TRY, BIEN, and dozens of taxon-specific repositories), promotes shared data schemas, and develops infrastructure for reproducible trait-based research at global scales.
- Website: opentraits.org
- GitHub: open-traits-network
- Key paper: Gallagher, R. V., et al. (2020). Open Science principles for accelerating trait-based science across the Tree of Life. Nature Ecology & Evolution, 4(3), 294–303. https://doi.org/10.1038/s41559-020-1109-6
- Data standards: Keller, A., et al. (2023). A standardized dataset of trait observations from citizen science and natural history collections. Methods in Ecology and Evolution, 14(1), 76–87. https://doi.org/10.1111/2041-210X.14033
Scaling and Allometry Data
Open datasets from lab publications spanning biomass allocation, nutrient scaling, leaf morphology, community productivity, and whole-plant allometry. These datasets underpin cross-scale tests of metabolic scaling theory and macroecological allometry and are made available to support reproducible synthesis.
Biomass Allocation and Growth — Niklas & Enquist (2004)
ORNL DAAC · 703
Biomass allocation and growth data for seeded plants spanning diverse life forms and environments. Captures relationships between root, stem, leaf, and reproductive biomass as a function of total plant mass — foundational for testing metabolic scaling predictions of biomass partitioning across plant size and functional group.
Why it matters: One of the most-cited compilations for cross-species allometric analysis of plant biomass fractions. Directly underpins tests of WBE/MST predictions and the ontogenetic allometry literature.
Citation: Niklas, K. J., & Enquist, B. J. (2004). Biomass Allocation and Growth Data of Seeded Plants (Version 1). ORNL DAAC. doi:10.3334/ORNLDAAC/703
Data: NASA Earthdata / ORNL DAAC 703 · Accessed: 2026-05-06
N and P Scaling in Seed Plants — Kerkhoff et al. (2006)
American Naturalist · 168:4 · E103–E122
Comparative scaling analysis of nitrogen (N) and phosphorus (P) content across leaves, stems, roots, and reproductive structures of 1,287 species in 152 seed plant families. Includes N:P ratios within and across organs, with contrasts between woody and herbaceous taxa.
Why it matters: Plant biomass and nutrient allocation directly connect evolved strategies of plant species to the material and energy cycles of ecosystems. N and P availability frequently limits plant growth, and this global compilation establishes scaling rules linking stoichiometry to plant size and growth form — essential for earth-system models of nutrient cycling.
Citation: Kerkhoff, A. J., Fagan, W. F., Elser, J. J., & Enquist, B. J. (2006). Phylogenetic and growth form variation in the scaling of nitrogen and phosphorus in the seed plants. The American Naturalist, 168(4), E103–E122. doi:10.1086/507879
Data: Appendix C (ZIP) — University of Chicago Journals supplemental file
Leaf Allometry — Price & Enquist (2007)
Ecology · 88:1132–1141
Intra- and interspecific scaling of leaf area, leaf mass, petiole dimensions, and tissue density for 622 leaves across 21 species (~30 leaves per species). Extends the WBE model to leaf-level morphology and provides a rare intraspecific allometry benchmark.
Why it matters: Intraspecific allometry is poorly characterized relative to interspecific patterns. This dataset enables direct tests of whether the same scaling exponents hold within and across species — a key question for scaling theory — and provides ground-truth data for leaf economic spectrum and hydraulic architecture models.
Citation: Price, C. A., & Enquist, B. J. (2007). Scaling mass and morphology in leaves: an extension of the WBE model. Ecology, 88(5), 1132–1141. doi:10.1890/06-1158
Data: Contact the lab — data from Price & Enquist (2007); see paper for variable definitions.
Sonoran Desert Plant Allometry — Price & Enquist (2006)
Sonoran Desert · 1,538 individuals
Scaling of biomass, cover, height, canopy dimensions, and basal stem diameter for 1,538 individual plants native and dominant in the Sonoran Desert around Tucson, Arizona. Data span a broad range of life forms and growth architectures characteristic of Sonoran Desert vegetation.
Why it matters: Among the most complete allometric datasets for a dryland plant community. Enables tests of universal versus biome-specific scaling exponents, supports remote sensing calibration (cover ↔ biomass), and provides a benchmark for semi-arid shrubland structure models.
Citation: Price, C. A., & Enquist, B. J. (2006); Price, C. A. (2006, Dissertation).
Data: A .csv file (Price_Enquist_Sonoran_Biomas_Data) is available — please contact the lab if interested in using this dataset.
Global Net Primary Productivity — Michaletz et al. (2014)
Nature · 2014
Global net primary productivity (NPP) data assembled to test metabolic scaling predictions of ecosystem-level productivity as a function of plant biomass and climate. These data span biomes from tundra to tropical forest and are linked directly to Figure 1 in the published paper.
Why it matters: Directly tests the metabolic scaling prediction that ecosystem NPP scales with standing biomass across biomes, linking individual-level physiology to global carbon cycling. Essential reference for earth-system model benchmarking and macroecological theory.
Citation: Michaletz, S. T., Cheng, D., Kerkhoff, A. J., & Enquist, B. J. (2014). Convergence of terrestrial plant production across global climate gradients. Nature, 512, 39–43. doi:10.1038/nature13470
Data: Available via Figure 1 in the online paper; for those without journal access, nature13470-f1.
Whole-Community Phytomass, Nutrients, and Productivity — Kerkhoff et al. (2005)
Cross-biome compilation
Compiled dataset on standing phytomass, net primary productivity (NPP), and vegetation nutrient (N and/or P) content of whole plant communities from published sources. Communities span arctic tundra to tropical forests across a wide range of environmental conditions and functional types. Nutrient data integrate all living vegetative components (roots, shoots, leaves) normalized to total vegetation biomass.
Why it matters: One of the few cross-biome datasets linking community-level biomass, productivity, and stoichiometry simultaneously. Enables tests of Ecological Stoichiometry theory at the community scale and links individual-level nutrient scaling to ecosystem nutrient budgets — a critical bridge between organism-scale allometry and earth-system biogeochemistry.
Citation: Kerkhoff, A. J., Enquist, B. J., Elser, J. J., & Fagan, W. F. (2005). Plant allometry, stoichiometry and the temperature-dependence of primary productivity. Global Ecology and Biogeography, 14(6), 585–598.
Data: Contact the lab for access to the compiled dataset.